
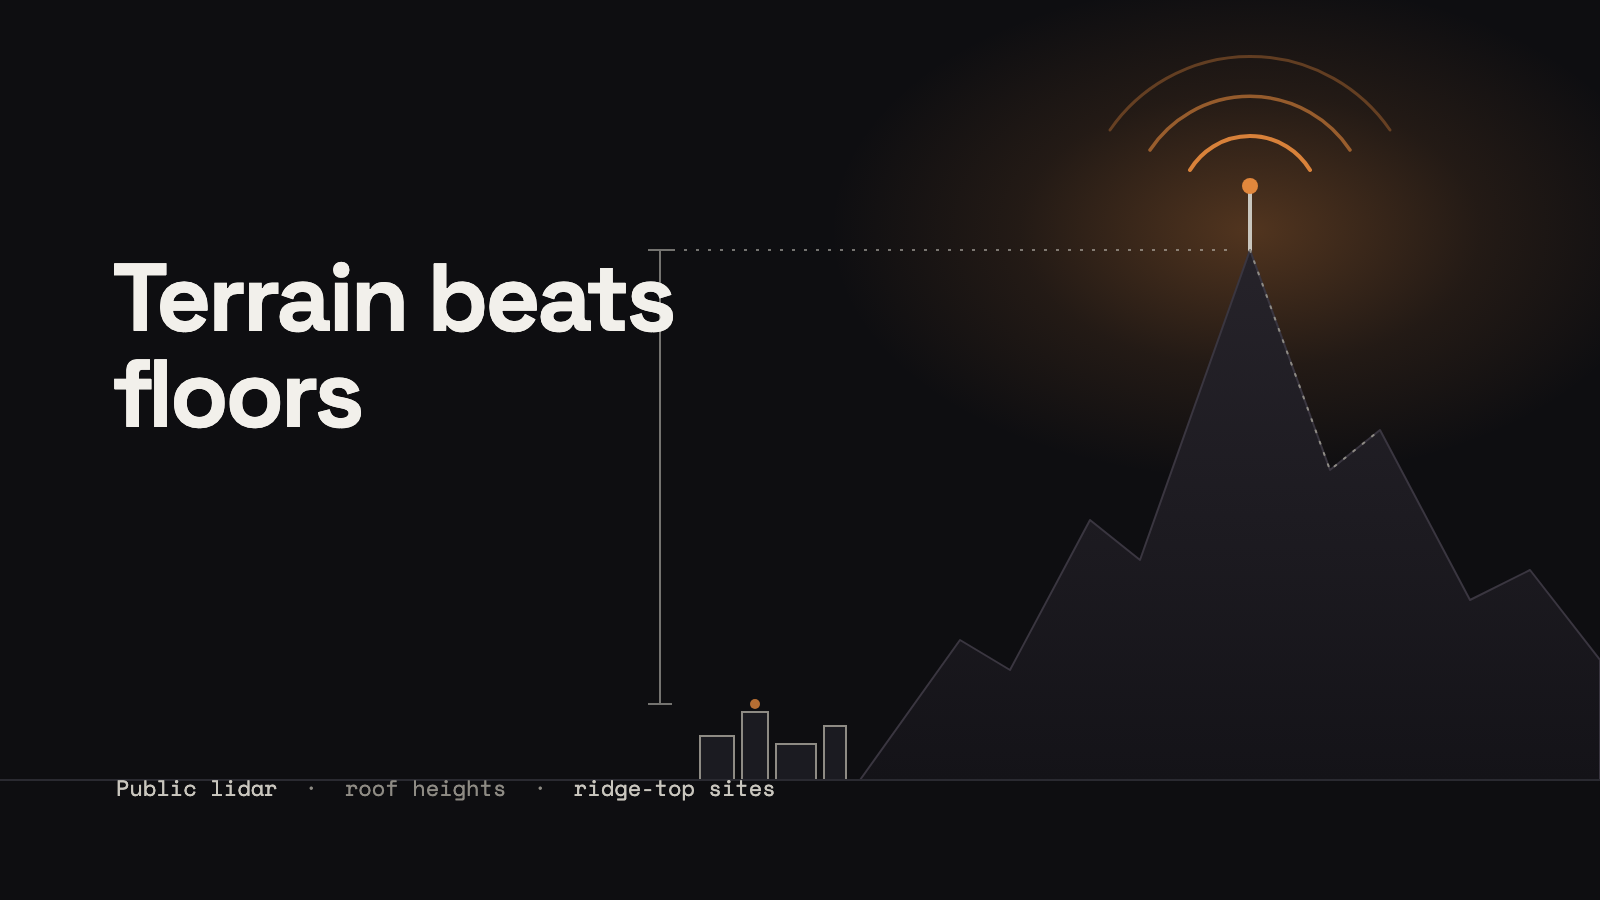
I spent a day ranking a large university's buildings as places to put a Meshtastic router, using public lidar and public terrain data. The best sites on the university's property list were not buildings at all. They were ridge-top sites. Terrain beat floors.
The question got bigger halfway through
It started as a question about one metro area. Partway in, I widened it to the whole state, so the ranking would serve the mesh statewide. That changed the ranking. A building now competes with every high place, not just its neighbours.
Where the heights came from
The university publishes its own facility inventory, and that gave me hundreds of buildings with addresses. Heights came from the USGS 3DEP lidar, which sits on a public AWS bucket in a format you can read a piece at a time, so you never download a whole flight. I read it in Python with laspy and clipped it to each building's footprint from OpenStreetMap.
For the radio side I used the free terrain tiles on AWS. Each pixel's colour encodes elevation (in the "terrarium" format, metres = R × 256 + G + B / 256 − 32768), and zoom 11 was plenty. From those I computed height above average terrain (HAAT), a 36-direction horizon for every site, and line of sight with Fresnel clearance at 915 MHz.
A percentile got fooled by trees
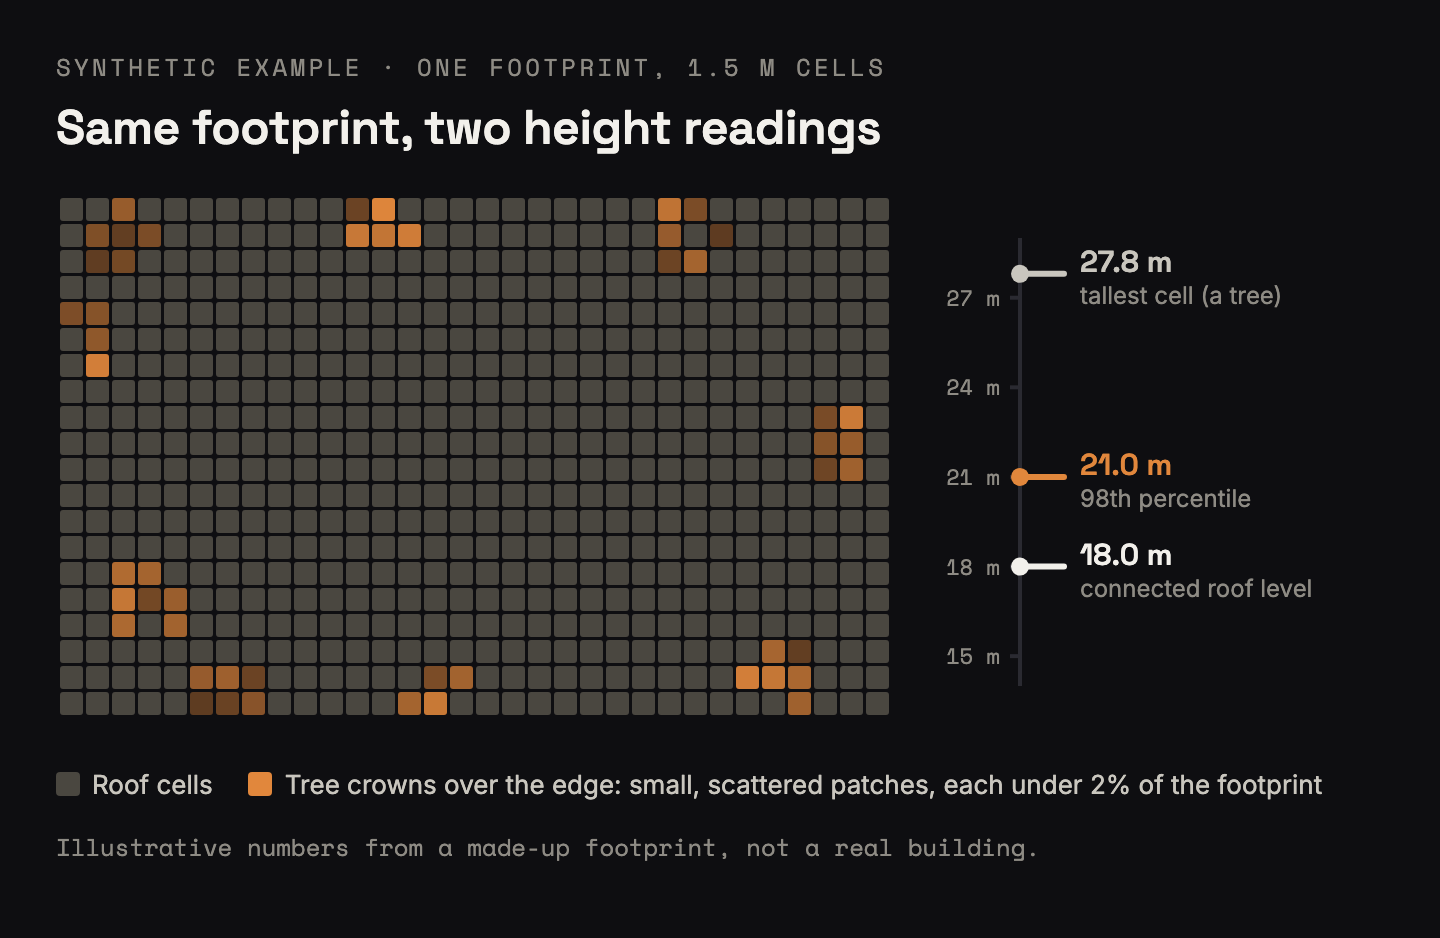
My first height estimate was the obvious one: take the 98th percentile of the lidar returns inside the footprint and call that the roof. It over-read by about 7 m, and it inflated 221 buildings by more than 3 m. The culprit was trees: crowns hanging over the footprint count as roof to a percentile.
The usual fixes, keeping only last returns or dropping points classified as vegetation, were not possible. The lidar flight I was reading classified only ground and noise, and it reported every return as a single return, so there was nothing to filter on.
Connected roof cells fixed it
The fix was to look for the shape of a roof instead of a statistic:
- Rasterise the footprint at 1.5 m and keep the highest return in each cell.
- Step down through height levels from the top.
- At each level, find the connected patches of cells at or above it.
- Take the highest level where one connected patch covers at least 2% of the footprint.
Tree crowns fail that test because they come out as small, ragged, separate patches. A roof is one big flat patch. A tower on top of a podium still passes, because the tower's roof is its own connected patch, as long as it covers 2%. Spot checks against published storey counts lined up.
The best roofs were on mountains
The best building had a HAAT of about 59 m. The best ridge-top site had a HAAT of more than 750 m, an order of magnitude better. No building came close.
The ridge sites also lined up with each other. With line of sight and Fresnel clearance checked, the model found long hops between them. Here is the modeled link budget for a hop of about 104 km at 915 MHz:
- Free-space path loss: about 132 dB.
- Combined antenna gain of 12 dBi brings that to about 120 dB.
- Meshtastic's radio settings page lists a 148 dB link budget for the MediumFast preset.
- That leaves about 28 dB of modeled margin.
That is a model built on terrain data, and none of it was tested on hardware. It still shows why high ground matters so much for LoRa.
The parts that were not magic
Negative numbers broke the score. A building that sits lower than the average of the terrain around it has a negative HAAT. More than three quarters of the buildings did. The score raised HAAT to a fractional power, which turns a negative number into an error, and an IFERROR quietly turned each error into the minimum score. The fix was one clamp, MAX(0, HAAT).
Point lookups grabbed the neighbours. Buildings without a mapped footprint got a height from a circle around their point, and a 31 to 45 m circle sweeps in whatever is next door. Every height from a circle got a low-confidence flag.
The forest won again. Some small buildings came back at 30 to 42 m. That was canopy. I added a ceiling by building type (6 m for a shed or pump house) and fell back to a typed estimate when the lidar went over it.
Old flights miss new buildings. The lidar was flown in 2020, so anything built since then reads short.
Coverage area rewarded empty desert. My first scoring counted how much ground a site could see, and the winners were sites that see a lot of nothing. A site is worth what it adds to the mesh that exists: radios it can reach that nothing else reaches, and at least one existing router in sight. With no router in sight, a site is an island, however high it is.
Judgment calls the data could not make
- Priority areas were off by default. Which towns deserve coverage first is my call, not the model's, so the spreadsheet carried proposed areas with a weight of zero unless I turned them on.
- Colour only where it encodes a metric. An early version tinted names and addresses by score. It was noise, and I had it removed.
- The best radio site is not always a usable one. Road access, snow and who manages the land all decide whether a site is realistic.
- This was a desk study. Putting anything on a roof or tower needs the owner's authorization.
If you are about to try this
- Do not trust a percentile on lidar near trees. Check whether your flight classifies vegetation before you plan on filtering it.
- Score what a site adds, not how much it can see or how crowded its neighbourhood is.
- Clamp anything you raise to a power, and never let an error handler hide a bad input as a low score.
- Look at your terrain before your roofs. Check the high ground in your area before you rank a single rooftop.
- Height does not pick the device role. Read Meshtastic's guide to ROUTER_LATE and the other infrastructure roles before anything goes up as a router.
Build it yourself
What it does: ranks a list of candidate sites for a mesh router by real structure height, terrain advantage and line of sight, and tells you which ones add the most to an existing mesh. The parts:
- A site list with addresses or coordinates. Public facility inventories are a good start.
- Heights: USGS 3DEP lidar on AWS, read with laspy, plus building footprints from OpenStreetMap.
- Terrain: the AWS terrain tiles for HAAT, horizons and line of sight.
- A spreadsheet with the weights in their own tab, so the ranking re-sorts when you change your mind.
Cost: nothing but time. All of the data is free.
If you have a better trick for separating roofs from tree crowns in lidar, I would like to hear it.